
How to Predict Concrete Strength with Machine Learning?
Concrete is a fundamental material in construction, and its compressive strength plays a vital role in determining the stability and safety of structures. Predicting concrete strength is crucial for engineers and builders to ensure that the right mix proportions are used, and the concrete meets the required standards. In this guide, we will walk through how to predict concrete compressive strength using machine learning, with step-by-step instructions and code examples.
Why Predict Concrete Strength with Machine Learning?
Machine learning is transforming industries by enabling data-driven decisions. Predicting concrete strength traditionally relied on empirical formulas and manual testing. However, machine learning offers a more efficient and accurate approach. With ML models, you can:
- Automate predictions for quicker decision-making.
- Improve accuracy by using data-driven insights.
- Handle large datasets to uncover hidden patterns.
In this article, we’ll explore how to use machine learning to predict concrete strength and help engineers make informed decisions in construction projects.
What You’ll Need for This Project?
Before jumping into the code, let’s go over the key tools and skills needed:
- Python: The programming language used to implement machine learning models.
- pandas: For data manipulation and cleaning.
- scikit-learn: A powerful library for building and evaluating machine learning models.
- matplotlib & seaborn: To create visualizations and explore the data.
Skills Required:
- Basic understanding of concrete properties.
- Familiarity with machine learning algorithms (especially regression).
- Basic data preprocessing and model evaluation techniques.
Data Overview
We will use the Concrete Compressive Strength dataset, which includes various factors like mix proportions (cement, water, and aggregates) and curing time to predict the compressive strength of concrete. This dataset will help us train a machine learning model that can accurately predict concrete strength.
Step 1: Install Required Libraries
If you haven’t installed the libraries yet, here’s how you can do it:
pip install pandas numpy scikit-learn matplotlib seaborn
Step 2: Import Necessary Libraries
Let’s import the libraries needed to load, process, and analyze the dataset.
import pandas as pd
import numpy as np
from sklearn.model_selection import train_test_split
from sklearn.linear_model import LinearRegression
from sklearn.metrics import mean_absolute_error, mean_squared_error, r2_score
import matplotlib.pyplot as plt
import seaborn as sns
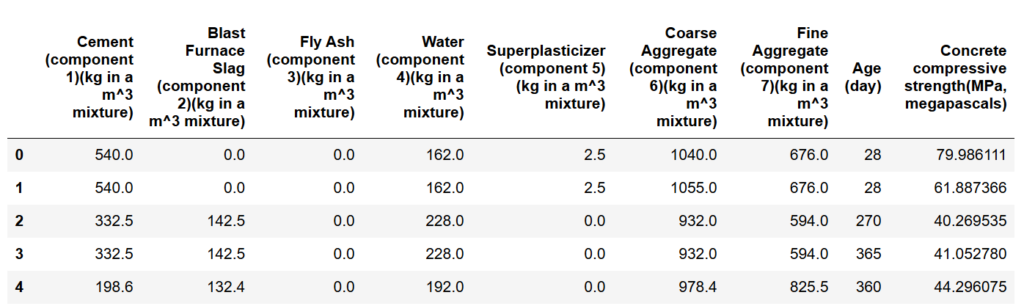
Step 3: Load the Concrete Dataset
We will load the Concrete Compressive Strength dataset and inspect the first few rows to understand its structure.
# Load the dataset
df = pd.read_excel("Concrete_Data.xlsx")

# Display the first few rows of the dataset
df.head()
Output:
Step 4: Explore the Data
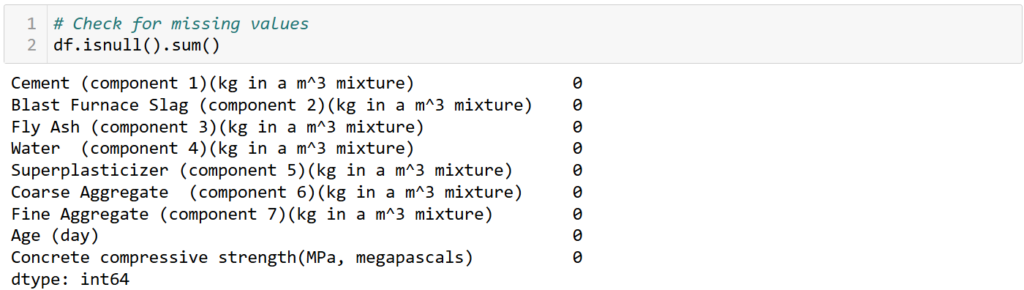
Now that we have the data, let’s check for missing values and explore the relationships between different variables. This will help us understand how each feature influences concrete strength.
# Check for missing values
print(df.isnull().sum())
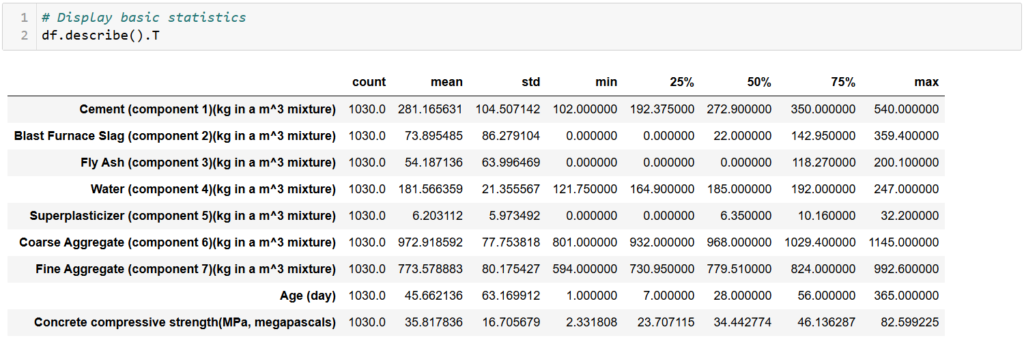
# Display basic statistics
print(df.describe())
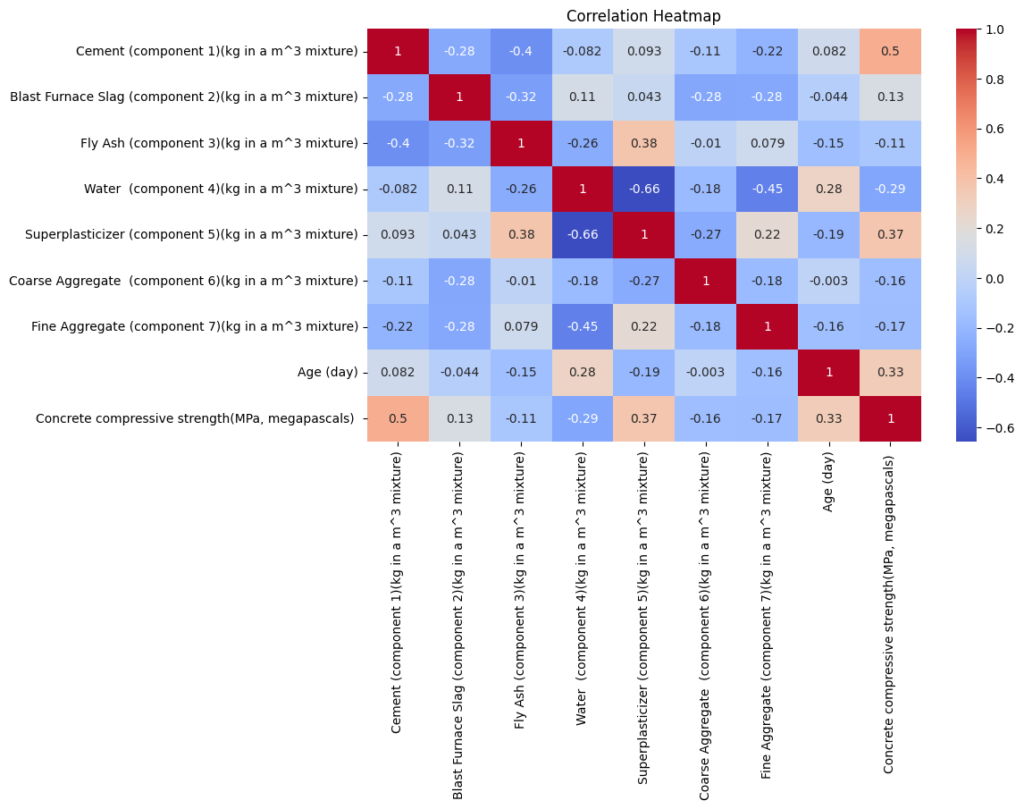
# Create a correlation heatmap to visualize the relationships between variables
plt.figure(figsize=(10, 6))
sns.heatmap(df.corr(), annot=True, cmap='coolwarm')
plt.title('Correlation Heatmap')
plt.show()
General Observations
Dataset Size:
The dataset contains 1030 observations for each variable, indicating no missing values in the summary
Component-Level Observations
Cement (component 1)
- Mean: 281.17 kg/m³ indicates the average amount of cement used per mixture.
- Range: Values vary significantly, from 102 kg/m³ (min) to 540 kg/m³ (max).
- Distribution:
- 25% of the samples use ≤192.38 kg/m³, while 75% use ≤350 kg/m³.
- Cement usage tends to concentrate in the mid-range.
Blast Furnace Slag (component 2)
- Mean: 73.90 kg/m³ suggests moderate use, but many mixtures may not include it.
- Min = 0: Some mixtures don’t use blast furnace slag.
- Max = 359.4: Certain mixtures rely heavily on it as a substitute for cement.
- Skewed Distribution:
- Median is 22 kg/m³, indicating many low-usage samples.
Fly Ash (component 3)
- Mean = 54.19 kg/m³: Fly ash is used sparingly.
- Min = 0: Some mixtures omit fly ash entirely.
- Max = 200.1 kg/m³: A few mixtures heavily utilize it.
- Median = 0: Over 50% of the samples don’t use fly ash.
Water (component 4)
- Mean = 181.57 kg/m³: Typical water content per mixture.
- Range:
- Min = 121.75 kg/m³, Max = 247 kg/m³.
- Controlled variation in water content likely ensures workability and strength.
- Concentration: 50% of samples use between 164.90–192 kg/m³.
Superplasticizer (component 5)
- Mean = 6.20 kg/m³: Average usage indicates minimal but significant impact.
- Min = 0: Some mixtures don’t use superplasticizers.
- Max = 32.20 kg/m³: Occasionally, high quantities are added for specific properties.
- Skewness: Most values lie in the lower range.
Coarse Aggregate (component 6)
- Mean = 972.92 kg/m³: Coarse aggregate dominates the mixture.
- Range: Min = 801 kg/m³, Max = 1145 kg/m³, showing consistent inclusion.
- Concentration:
- 50% of values are tightly grouped around the median (968 kg/m³).
Fine Aggregate (component 7)
- Mean = 773.58 kg/m³: Fine aggregate is another significant component.
- Range: Min = 594 kg/m³, Max = 992.60 kg/m³.
- Consistency: Values are concentrated, with most mixtures using between 730.95–824 kg/m³.
Time Factor
Age (days)
- Mean = 45.66 days: Average curing time.
- Range: Min = 1 day, Max = 365 days indicates diverse curing durations.
- Median = 28 days: Aligns with standard concrete curing practices.
Concrete Compressive Strength
Compressive Strength (MPa)
- Mean = 35.82 MPa: Typical strength of the concrete mixtures.
- Range: Min = 2.33 MPa, Max = 82.60 MPa reflects mixtures designed for different purposes.
- Distribution:
- 25% of samples have strengths below 23.71 MPa, while 75% are below 46.14 MPa.
- High-strength mixtures (>75 MPa) are rare but present.
Key Insights
- Cement and Aggregates: Cement, coarse aggregate, and fine aggregate dominate the mixture, with limited use of fly ash and slag in many samples.
- Superplasticizer and Water: Low but critical amounts of superplasticizers are used to adjust the mixture’s workability. Water content remains tightly controlled.
- Curing Time Variance: Mixtures with longer curing times likely correspond to higher compressive strengths.
- Strength Distribution: Most mixtures achieve moderate compressive strengths, with a few outliers designed for high-performance applications.
The above EDA steps are just for reference, you can do additional exploration to understand the data.
If you are interested in Machine Learning Projects, you can read my article on the topic Build a Sentiment Analysis API using Transformer and BERT.
Step 5: Data Preprocessing
To prepare the data for modeling, we will:
- Separate the target variable (concrete strength) from the features.
- Split the data into training and testing sets.
- Scale the features to improve model performance.
# Separate the features (X) and target (y)
X = df.drop(columns=['Concrete compressive strength(MPa, megapascals) '],axis=1)
y = df['Concrete compressive strength(MPa, megapascals) ']

# Split the data into training and testing sets
X_train, X_test, y_train, y_test = train_test_split(X, y, test_size=0.2, random_state=42)

# Scale the features (optional but helps with regression models)
from sklearn.preprocessing import StandardScaler
scaler = StandardScaler()
X_train = scaler.fit_transform(X_train)
X_test = scaler.transform(X_test)
Step 6: Build the Model
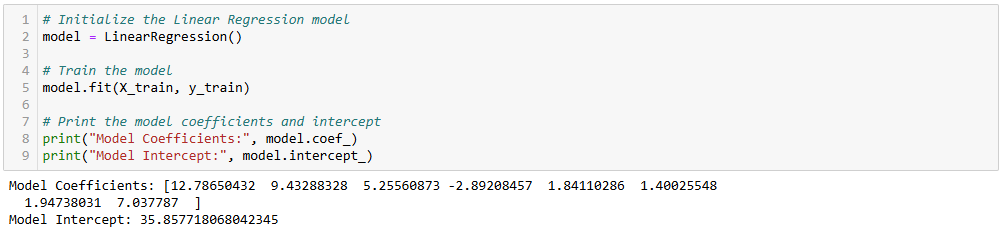
Now, let’s create a Linear Regression model to predict the compressive strength of concrete.
# Initialize the Linear Regression model
model = LinearRegression()

# Train the model
model.fit(X_train, y_train)

# Print the model coefficients and intercept
print("Model Coefficients:", model.coef_)
print("Model Intercept:", model.intercept_)
Output:
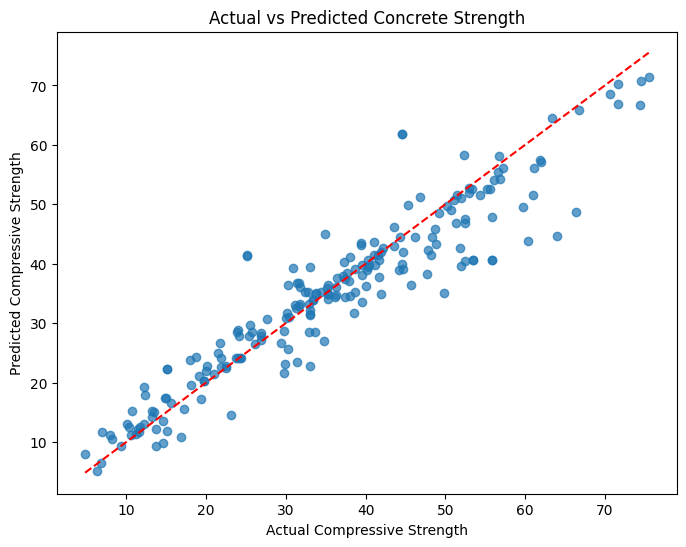
Step 7: Make Predictions
With the model trained, we can now make predictions on the test data and evaluate its performance.
# Make predictions on the test data
y_pred = model.predict(X_test)
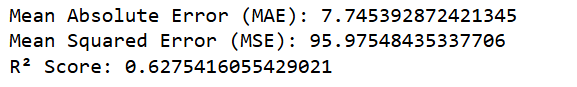
# Evaluate the model performance
mae = mean_absolute_error(y_test, y_pred)
mse = mean_squared_error(y_test, y_pred)
r2 = r2_score(y_test, y_pred)
# Print evaluation metrics
print("Mean Absolute Error (MAE):", mae)
print("Mean Squared Error (MSE):", mse)
print("R² Score:", r2)
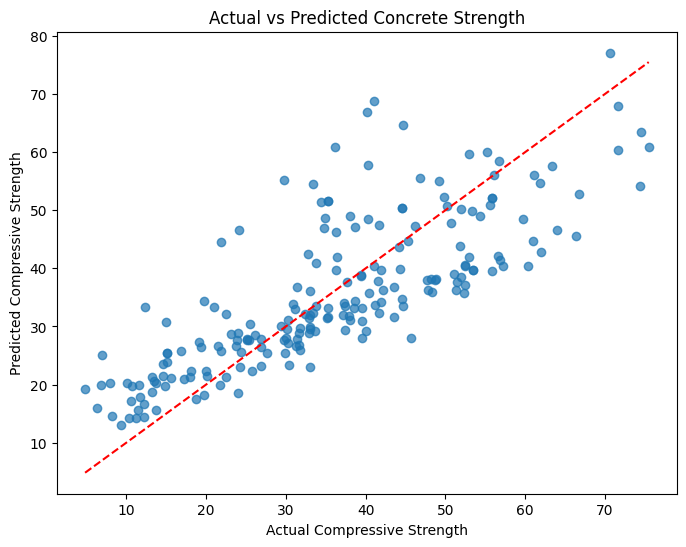
# Visualize the actual vs predicted values
plt.figure(figsize=(8, 6))
plt.scatter(y_test, y_pred, alpha=0.7)
plt.plot([y_test.min(), y_test.max()], [y_test.min(), y_test.max()], '--r')
plt.xlabel('Actual Compressive Strength')
plt.ylabel('Predicted Compressive Strength')
plt.title('Actual vs Predicted Concrete Strength')
plt.show()
Output:
Interested in Generative AI? Check out my latest post on AISuite by Andrew NG!
Step 8: Try Advanced Models
If you want to further improve the model, you can use more complex algorithms like Random Forest Regressor. Let’s try it out.
from sklearn.ensemble import RandomForestRegressor

# Initialize the Random Forest Regressor model
rf_model = RandomForestRegressor(random_state=42)

# Train the model
rf_model.fit(X_train, y_train)

# Make predictions
y_pred_rf = rf_model.predict(X_test)

# Evaluate the model performance
mae_rf = mean_absolute_error(y_test, y_pred_rf)
mse_rf = mean_squared_error(y_test, y_pred_rf)
r2_rf = r2_score(y_test, y_pred_rf)

# Print evaluation metrics for Random Forest model
print("Random Forest MAE:", mae_rf)
print("Random Forest MSE:", mse_rf)
print("Random Forest R² Score:", r2_rf)

# Visualize the actual vs predicted values for RandomForestRegressor
plt.figure(figsize=(8, 6))
plt.scatter(y_test, y_pred_rf, alpha=0.7)
plt.plot([y_test.min(), y_test.max()], [y_test.min(), y_test.max()], '--r')
plt.xlabel('Actual Compressive Strength')
plt.ylabel('Predicted Compressive Strength')
plt.title('Actual vs Predicted Concrete Strength')
plt.show()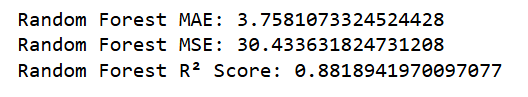
Conclusion
We’ve successfully predicted concrete compressive strength using machine learning. Here’s a recap of what we did:
- Data Preprocessing: Cleaned and scaled the dataset.
- Model Training: We started with a simple Linear Regression model and evaluated its performance.
- Advanced Modeling: We also tested a Random Forest Regressor for better accuracy.
GitHub Repository Link: https://github.com/data-coach/predict-concrete-strength-using-machine-learning.git
This project not only demonstrates how to predict concrete strength but also highlights how machine learning can make predictions more accurate and reliable in real-world applications like construction. Contact Us if you need any assistance!
Take It to the Next Level
If you’re ready to enhance your model, try experimenting with different machine learning algorithms, optimizing the model’s hyperparameters, or adding more features to the dataset. The possibilities are endless!
Discover how to predict concrete compressive strength using Python and machine learning. Follow this beginner-friendly guide with code examples and tips.
Comments